

Related: Mining for Economic Gold
Analysis: Look Deeper Into GDP Numbers for Better Trucking Insight
GDP doesn't always tell the whole story of trucking's economic climate. That's why MacKay & Company developed its proprietary measure, Truckable Economic Activity, reflecting the portion of the GDP that spends its time in trucks.

Evan Lockridge・Former Business Contributing Editor

Photo: istockphoto.com/rimeimages
3 min to read

As you’re reading this, one of first and most closely watched indicators of the overall economic performance of the American economy has been issued. And while it’s the first major reading of how conditions are shaping up for 2017, you are best advised not to read too much into the figures, be it good or bad.
The federal government’s reading of the gross domestic product, a measure of the country’s total output of goods and services, had yet to be released at press time, but many analysts were expecting it to reflect an expansion of just a 1% to 2% annual rate. That’s compared to a 2.1% rate in the final quarter of last year and 3.5% in the third quarter of 2016. In other words, the consensus is a less than stellar first quarter performance.
However, the first quarter can be a bit “quirky,” says Bob Dieli, chief economist at the commercial trucking market research firm MacKay & Company.
“Weather has increasingly become a factor in [the] first quarter,” he told HDT in an interview. Remember the Polar Vortex in early 2014? The extremely cold weather in much of the country killed GDP for the quarter. And while not as bad, the U.S. did get hit with some powerful weather last month.
“I would not put a whole lot of trust in the first [GDP] number for the first quarter,” Dieli said. Each quarterly GDP performance can be revised two times with more complete data, including foreign trade. And it’s these foreign trade numbers than can play hell with trying to make sense out of the GDP when it comes to trucking.
As Uncle Sam counts it, when goods are imported, they count as a negative to the GDP. In contrast, export goods, because they are made in the U.S., are considered a positive. Problem is, the U.S. consistently has more exports than imports, which can weigh down the GDP to one extent or another.
That’s one reason MacKay & Company developed its proprietary measure, Truckable Economic Activity, reflecting the portion of the GDP that spends its time in trucks. This measure, unlike the GDP, counts half of imports as positive. “We think that an import generates fewer truck moves than a good that has been on our shores the whole time,” Dieli explained — but it’s still considered a positive, unlike how it’s reflected in the GDP.
At the end of May, MacKay & Company will release its first quarter Truckable Economic Activity, which relies not only on the government’s initial first quarter GDP performance, but also on the revised and more complete second one of those three reports.
Also unlike the GDP report, the TEA report measures economic activity, not from quarter to quarter, but rather year-over-year, meaning the first quarter of 2017 is compared to the same time in 2016.
Such a different comparison, Dieli said, is done “because of questions of volatility” about quarter-to-quarter GDP numbers, and it’s easier to explain how the economy is doing.
The most recent TEA report showed the nation’s “truckable economy” expanded at a rate of 2.9% in the fourth quarter of 2016 compared to a year earlier, while federal GDP numbers showed just a 2.1% annual increase – a fairly significant difference.
That’s also because TEA measures only goods – not good and services, like the GDP reports. The service sectors of housing and medical care make up the largest two GDP components, Dieli said – but they don’t travel by truck.
So, as you’re reading about the first report on GDP performance this month, or anytime in the future for that matter, keep in mind while it’s important, it doesn’t necessarily tell you everything you need to know when it comes to the trucking part of the economy.
Subscribe to Our Newsletter
More Fleet Management
How Innovative Trucking Leaders Turn Change Into an Advantage
As the pace of change accelerates in trucking, the fleets that adapt best have more than the latest technology. They have cultures that embrace improvement.
Read More →
Freight Broker Bonds Just Got Harder to Get. Here's What That Means for Your Fleet.
When it gets harder for a freight broker to prove they are financially sound, the ones who cannot clear that bar get pushed out of the market. And those are exactly the brokers who used to leave motor carriers holding the bag.
Read More →
Long-Awaited Canadian Border Bridge to Open in Detroit
For trucking, the bridge opening should offer immediate improvements in efficiency and reliability, with new customs facilities, expanded inspection capacity, and direct freeway-to-freeway connections.
Read More →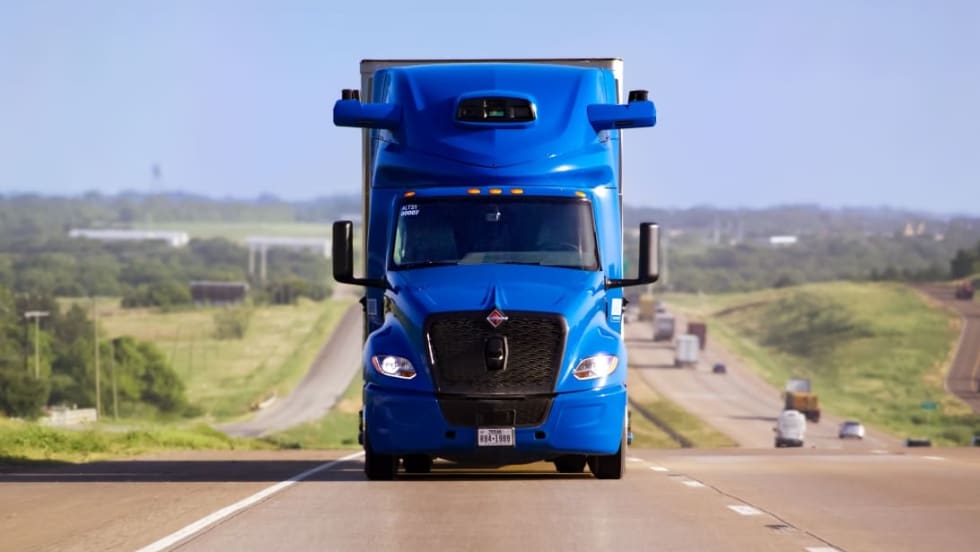
Aurora Rolls Out Next Generation of Driverless Trucks for Commercial Freight
Aurora's latest autonomous trucks it's rolling out with International feature lower-cost hardware designed for a million miles as the company expands commercial driverless freight operations across the U.S. Sun Belt.
Read More →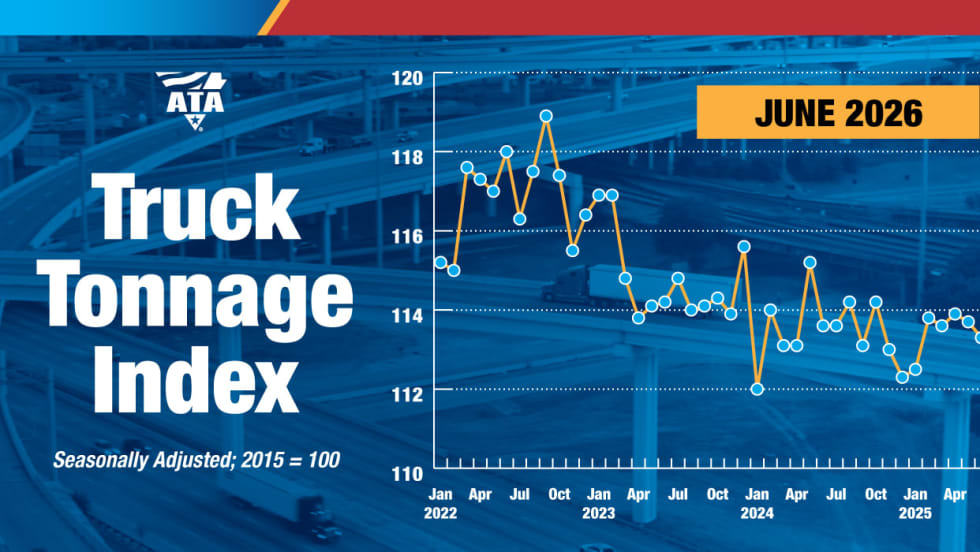
Freight Tonnage Down, Rates up, as Lower Capacity Powers Trucking Recovery
The recovery from the freight recession continues to be driven by reduction in capacity rather than by increased demand.
Read More →
Think Your Trucking Fleet Isn't Using Much AI? Think Again
Shadow AI — the use of unauthorized artificial intelligence tools at work — is becoming increasingly common, putting sensitive company data at risk. Learn how trucking fleets can protect sensitive data while embracing AI.
Read More →
ArcBest Consolidates Brands, Cuts Workforce
The company will bring three business units under the ArcBest brand, eliminate about 2% of positions, and expects the changes to generate $40 million in annual savings.
Read More →
Trucking Fleets Faced Record Operating Costs During Third Year of Freight Recession
ATRI's annual operational cost report shows carriers trimmed fleets, delayed equipment purchases, and ran older trucks as expenses continued to outpace freight rates.
Read More →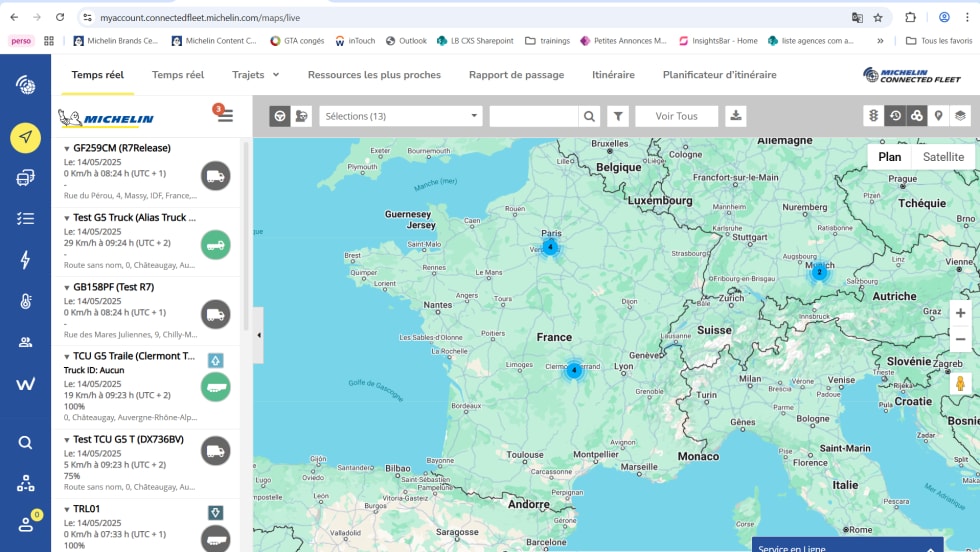
Michelin Adds AI Assistant to MyConnectedFleet Platform
Michelin’s new generative AI tool delivers instant fleet insights, helping managers analyze fuel use, tire maintenance, vehicle status, and operational performance without manually creating reports.
Read More →
LytxOne Platform Now Features AI, Compliance, and Asset Tracking Tools
New enhancements add AI-powered insights, asset tracking, compliance automation, and configurable privacy controls to Lytx's all-in-one fleet management platform.
Read More →