

Freight Shipments Rise in November
The amount of freight carried by the for-hire transportation industry rose 1.7% in November from October, rising after a one-month decline. This information is according to the U.S. Department of Transportation's Bureau of Transportation Statistics' Freight Transportation Services Index. The November 2012 index level (108.9) was 15.5% above the April 2009 low during the recession
The amount of freight carried by the for-hire transportation industry rose 1.7% in November from October, rising after a one-month decline. This information is according to the U.S. Department of Transportation's Bureau of Transportation Statistics' Freight Transportation Services Index.
The November 2012 index level (108.9) was 15.5% above the April 2009 low during the recession.
BTS, a part of the Research and Innovative Technology Administration, reported that the level of freight shipments in November measured by the Freight TSI (108.9) was 4.5% below the all-time high level of 114.0 in December 2011.
The Freight TSI measures the month-to-month changes in freight shipments by mode of transportation in tons and ton-miles, which are combined into one index. The index measures the output of the for-hire freight transportation industry and consists of data from for-hire trucking, rail, inland waterways, pipelines and air freight.
Analysis: The Freight TSI increased in November 2012, at least in part as a result of recovery from Hurricane Sandy, which depressed both truck and freight rail traffic in October. Both rail freight and trucking showed large increases in November.
Trend: Since peaking in December 2011 (114.0) at the highest level in the 22-year history of the Freight TSI series, the index remained in a narrow band through the first 11 months of 2012, except for a drop in October to 107.1, its lowest level since May 2011 (105.2). The index then returned in November to its level of one year ago in November 2011. After dipping to 94.3 in April 2009 during the recession, freight shipments increased in 28 of the last 43 months, rising 15.5% during that period.
Index highs and lows: Freight shipments in November 2012 (108.9) were 15.5% higher than the recent low in April 2009 during the recession (94.3). In April 2009, freight shipments were at their lowest level since June 1997 (92.3). The November 2012 level is down 4.5% from the historic peak reached in December 2011 (114.0).
Long-term trend: Freight shipments are down 0.4% in the five years from the pre-recession level of November 2007 but are up 4.7% in the 10 years from November 2002 despite declines in recent years.
Same month of previous year: November 2012 freight shipments were unchanged from November 2011, but rose 8.8% from November 2009, shortly after the end of the recession. Shipments measured by the index remained below the level of November 2005 (112.5) two years prior to the recession.
The TSI has three seasonally adjusted indexes that measures changes from the monthly average of the base year of 2000. The three indexes are freight shipments, passenger travel and a combined measure that merges the freight and passenger indexes. TSI includes historical data from 1990 to the present. Release of the December 2012 index is scheduled for Feb. 13.
Passenger Index: The TSI for passengers rose 0.1% in November from its October level. The Passenger TSI November 2012 level of 117.6 was 2% above the November 2011 level. The index is up 0.4% in five years and up 23.3% in 10 years. The passenger TSI measures the month-to-month changes in travel that involves the services of the for-hire passenger transportation sector. The seasonally adjusted index consists of data from air, local transit and intercity rail.
Combined Index: The combined freight and passenger TSI rose 1.2% in November from its October level. The combined TSI November 2012 level of 111.2 was 0.6% above the November 2011 level. The combined index is down 0.1% in five years but up 9.7% in 10 years despite recent declines. The combined TSI merges the freight and passenger indexes into a single index.
More Aftermarket

AUCTION OF EQUITY INTEREST IN HEAVY HAUL TRUCKING COMPANY!!
Mark your calendar: June 30, 2026 (10:00 a.m. PDT). MagnaTrans, LLC, a California limited liability company doing business as Magna Transportation Group is going to auction! Bid on a 37.5% ownership interest in this Rancho Cucamonga-based heavy haul and over-dimensional trucking company operating across California, Oregon, and Arizona. The equity interest will be sold to the highest bidder or bidders under Article 9 of the Uniform Commercial Code at 10:00 a.m. PDT.
Read More →
Phillips Opens High-Tech Distribution Center for Faster Parts Delivery
Phillips Industries’ new Cincinnati-area distribution center is now shipping aftermarket trucking parts nationwide, aiming to speed up delivery times for customers.
Read More →
Volvo to Sponsor America’s Road Team for 2025
Volvo Trucks announced that it is extending its exclusive sponsorship of America’s Road Team for 2025.
Read More →
Webb to Start Taking Orders for UltraSet Pre-Adjusted Wheel Hubs
Webb, which recently acquired the Stemco Trifecta pre-adjusted hub program, will soon start taking orders for its replacement pre-assembled hub, the UltraSet.
Read More →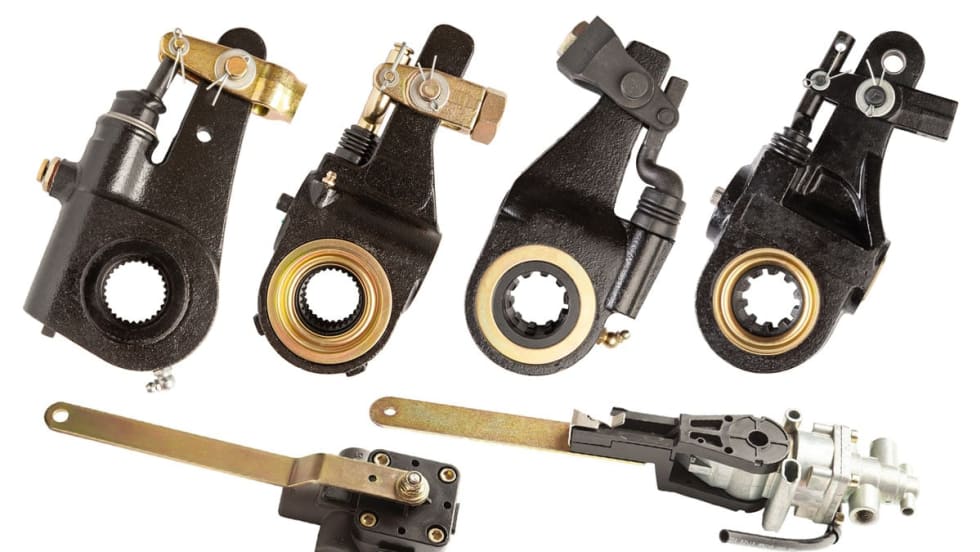
All-Makes Automatic Brake Adjusters, Ride Height Control Valves from Midland
SAF-Holland has added automatic brake adjusters and ride height control valves to its Midland All-Makes Program.
Read More →
ZF Aftermarket Expands [pro]Academy Training
ZF Aftermarket said it is expanding its ZF [pro]Academy training and will be adding 40 new modules this year.
Read More →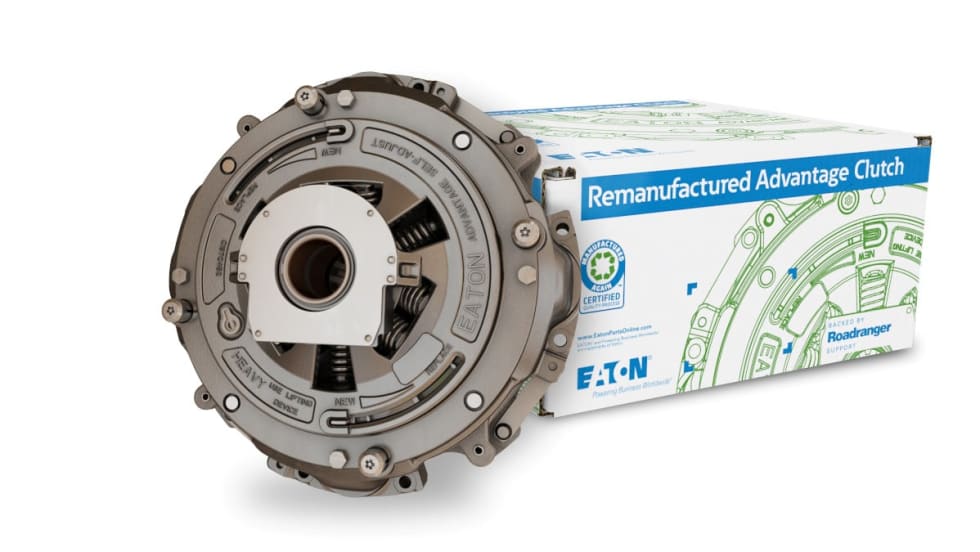
Eaton Adds Remanufactured Advantage Line of Clutches
Eaton has added its Advantage clutches to its remanufactured product line. The clutches feature a unique strap drive intermediate plate designed to allow customers to choose the latest OE specification
Read More →
ConMet Acquires TruckLabs, the Creator of TruckWings
Commercial truck and trailer parts provider ConMet acquired TruckLabs, the company that created TruckWings, an aerodynamic device that attaches to truck cabs and deploys to close the gap between truck and trailer. TruckLabs now operates as a subsidiary of ConMet.
Read More →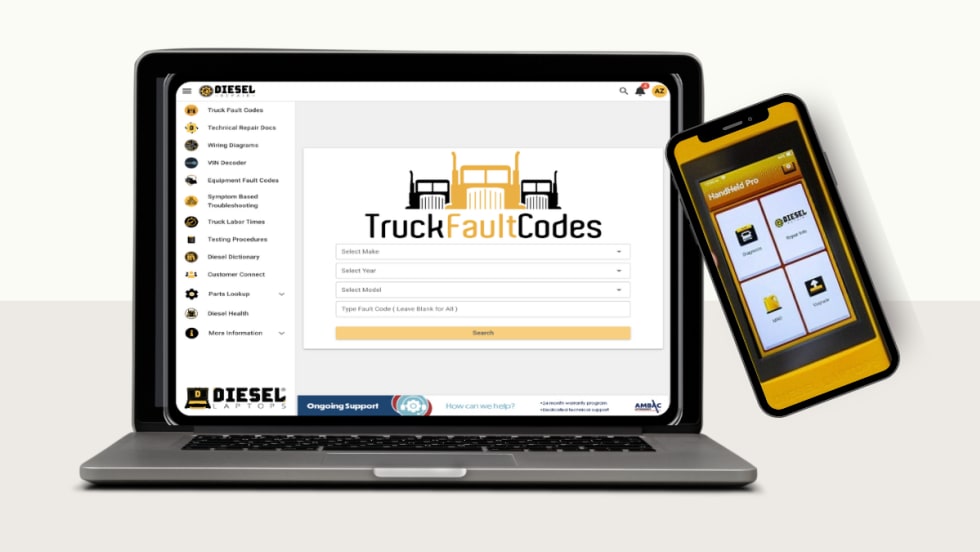
Diesel Laptops Releases Fault-Code-to-Part-Number Tool
Diesel Laptops said its Truck Fault Codes allows users to input a fault code and immediately identify and order the parts needed to complete repair work.
Read More →
Heavy Duty Parts and Labor Costs Dropped in Q2
A benchmarking report from TMC and Decisiv reveals good news for fleets as heavy-duty parts and labor costs dropped in the second quarter of 2023.
Read More →