

Inside the Numbers Driving the Heavy-Duty Trucking Industry
There are many ways to tell a story – through words in books and magazines, pictures, videos, song, and more. With the inaugural issue of the HDT Fact Book, we are telling trucking’s story through facts, numbers, statistics, charts, and graphs.


There are many ways to tell a story – through words in books and magazines, pictures, videos, song, and more. With the inaugural issue of the HDT Fact Book, we are telling trucking’s story through facts, numbers, statistics, charts, and graphs.
Our editorial team has combed through publicly available statistics and worked with researchers and analysts to bring you insights on the current state of the industry, as well as historical trends and future forecasts. Accurate data and information are critical to making good decisions. These numbers can help you in planning and benchmarking your fleet, and in telling trucking’s story to others.
Our hope is that once you’ve looked through all the charts and graphs in this month’s issue, and likely learned a few things you didn’t know before, that you’ll keep this magazine handy all year long as a readily available reference guide.
We’re going to make this an annual project, so let us know how we can make the Fact Book even better for next year. Is there a subject area you’d like us to add? Are there particular statistics or other facts you’d like to know? Email HDT Editor Deborah Lockridge at dlockridge@truckinginfo.com.
View charts and slides showing data points from six categories:
More Aftermarket

AUCTION OF EQUITY INTEREST IN HEAVY HAUL TRUCKING COMPANY!!
Mark your calendar: June 30, 2026 (10:00 a.m. PDT). A 37.5% ownership interest in MagnaTrans, LLC, a California limited liability company doing business as Magna Transportation Group, will be sold in an in-person and online auction to the highest bidder or bidders under Article 9 of the Uniform Commercial Code. The Rancho Cucamonga-based heavy haul and over-dimensional trucking company operates across California, Oregon, and Arizona.
Read More →
Phillips Opens High-Tech Distribution Center for Faster Parts Delivery
Phillips Industries’ new Cincinnati-area distribution center is now shipping aftermarket trucking parts nationwide, aiming to speed up delivery times for customers.
Read More →
Volvo to Sponsor America’s Road Team for 2025
Volvo Trucks announced that it is extending its exclusive sponsorship of America’s Road Team for 2025.
Read More →
Webb to Start Taking Orders for UltraSet Pre-Adjusted Wheel Hubs
Webb, which recently acquired the Stemco Trifecta pre-adjusted hub program, will soon start taking orders for its replacement pre-assembled hub, the UltraSet.
Read More →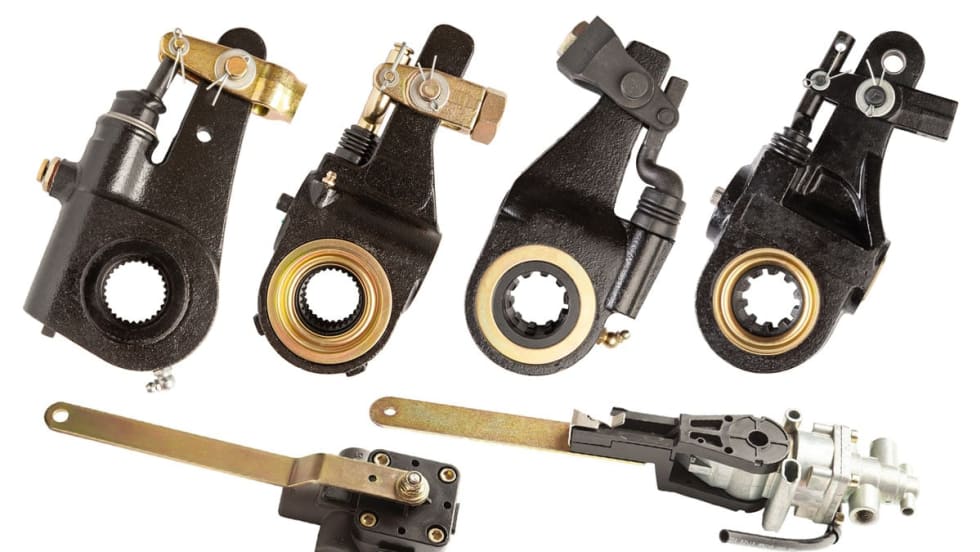
All-Makes Automatic Brake Adjusters, Ride Height Control Valves from Midland
SAF-Holland has added automatic brake adjusters and ride height control valves to its Midland All-Makes Program.
Read More →
ZF Aftermarket Expands [pro]Academy Training
ZF Aftermarket said it is expanding its ZF [pro]Academy training and will be adding 40 new modules this year.
Read More →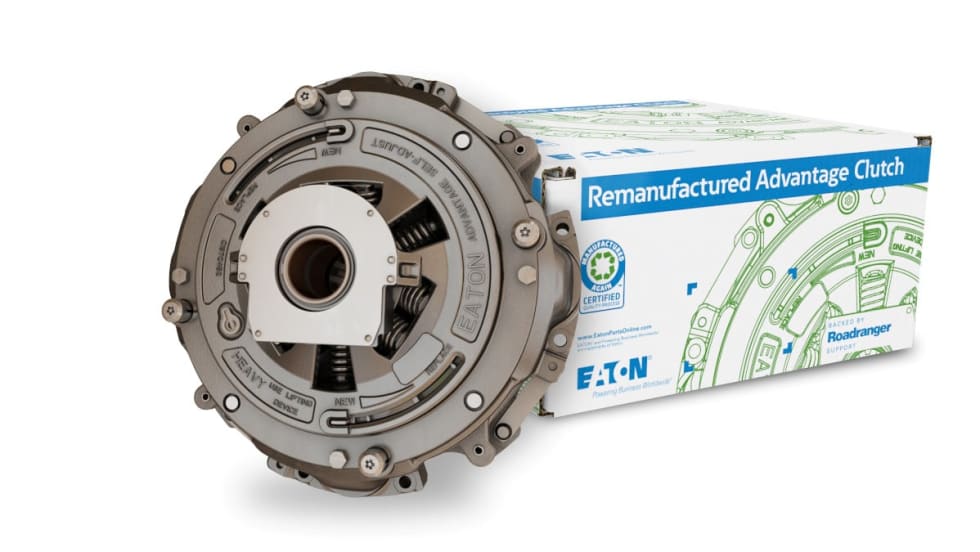
Eaton Adds Remanufactured Advantage Line of Clutches
Eaton has added its Advantage clutches to its remanufactured product line. The clutches feature a unique strap drive intermediate plate designed to allow customers to choose the latest OE specification
Read More →
ConMet Acquires TruckLabs, the Creator of TruckWings
Commercial truck and trailer parts provider ConMet acquired TruckLabs, the company that created TruckWings, an aerodynamic device that attaches to truck cabs and deploys to close the gap between truck and trailer. TruckLabs now operates as a subsidiary of ConMet.
Read More →
Diesel Laptops Releases Fault-Code-to-Part-Number Tool
Diesel Laptops said its Truck Fault Codes allows users to input a fault code and immediately identify and order the parts needed to complete repair work.
Read More →
Heavy Duty Parts and Labor Costs Dropped in Q2
A benchmarking report from TMC and Decisiv reveals good news for fleets as heavy-duty parts and labor costs dropped in the second quarter of 2023.
Read More →